Cross Book — A recovery needs more than a weaker dollar
Retrospective research sample · September 7, 2026 · Reference information cutoff: 18:10 UTC / 2:10 p.m. ET. Matched delayed futures/dollar prices through 1 p.m. ET; regional coverage is selective and availability of every reference at the cutoff is not established. U.S. cash references remain Friday's. Watch scenarios, not active trade alerts.
The Week in Two Minutes
Desk view: dollar weakness has opened a question that the other markets have not answered. Nasdaq has recovered, while ES, gold and Treasury futures remain below their opening prints. Inflation week tests whether that split resolves into rates relief or exposes a fragile recovery. Keep the tactical opportunities separate; a longer-term bullish thesis is not established.
- Indices: watch ES 7,715.25 and NQ 29,595.25. NQ ended above its reference; ES remained below. Nasdaq losing its recovery would weaken the bullish case, while ES still needs a reclaim. No standing entry; Monday has no U.S. cash-session confirmation.
- Energy: diesel strength is more convincing than gasoline strength in this window. The diesel advantage narrowed but remains above its opening comparison. A loss of that relative strength would weaken the watch; Thursday's noon ET inventories test the broader tightness thesis. No refiner or spread entry is qualified.
- Earnings: demand must survive the macro test. Broadcom's AI outlook needs a better relative price response. Oracle and Adobe report Thursday evening, ahead of Friday's 8:30 a.m. ET CPI. Watch company strength that holds through inflation; stand down if it fails while the broader market stabilizes.
Holiday watch — Monday is not a normal cash session
NYSE markets are closed September 7 for Labor Day. CME equity-index and rate futures entered preopen at 1 p.m. ET Monday; energy and metals at 2:30 p.m. ET. Matching resumes at 6 p.m. ET. The Sunday opening and Monday activity carry Tuesday, September 8's trade date. A calendar date and a futures trade date are not interchangeable. NYSE calendar · CME holiday hours
There are no regular CME-group settlements Monday; intraday last prices are not new official settlements. CME notice
The implication: assess holiday futures moves on their own evidence. They cannot establish confirmation from an absent U.S. cash session. Friday's expired intraday plans remain expired; Tuesday requires a fresh map.
The opening recovery is uneven
From Sunday 6 p.m. to Monday 1 p.m. ET, delayed TradingView fifteen-minute bars show the following matching windows. These are bar endpoints, not settlements, daily returns or simultaneous executable quotes.
| Market | Opening print → final bar close |
|---|---|
| September ES / ESU2026 | 7,715.50 → 7,708.75 |
| September NQ / NQU2026 | 29,535.25 → 29,603.50 |
| December gold / GCZ2026, USD/oz | 4,466.50 → 4,460.50 |
| December 10-year Treasury futures / ZNZ2026, price points | 107.453125 → 107.359375 |
| ICE dollar index / DXY | 99.170 → 98.871 |
Nasdaq's final four fifteen-minute closes were at or above 29,595.25, but each bar also traded below that reference. Its recovery is tentative. ES remained below 7,715.25, while gold and Treasury futures stayed below their opening prints even with the weaker dollar. That keeps the broad recovery thesis conditional. These observations do not activate an entry; Treasury futures prices are not cash yields.
Europe's close reinforces the need for selectivity: the STOXX 600 finished broadly flat at 649.90, with energy shares up 1.2%. Sector strength does not establish broad risk appetite or independently validate the U.S. diesel comparison. Reuters closing report
A better month is not yet a trend
August payrolls increased 162,000 and unemployment held at 4.1%. Upward revisions added 55,000 to June and July. Yet those three monthly gains average roughly 71,000. Food services and local-government education supplied 101,000 of August's increase; the education gain largely reversed a prior decline. Wages increased 0.3% monthly and 3.1% annually. BLS release
Our interpretation: this challenges an uncomplicated labor-cooling thesis, while leaving room for a softer underlying trend. It does not settle inflation, the next policy decision or the direction of the next market move. The opportunity depends on the gap between new information and expectations already embedded in prices. A verified consensus and policy-pricing snapshot are still needed before calling either release a surprise.
Three paths through the week
Friday's rates check: Treasury's September 4 par yields were 4.37% at two years and 4.78% at ten years, up 3 and 1 basis points respectively from Thursday. The spread narrowed from 43 to 41 basis points. That daily move is consistent with some pressure on the rates-relief case, but does not isolate payrolls as the cause or establish policy odds. The next test is whether that pressure persists through inflation and appears in index prices. Treasury official yield feed
Index recovery through inflation
- Status
- Watch; competing tactical scenarios, not a structural bullish call.
- View
- A weaker dollar needs confirmation from rates and the selected index. NQ has reclaimed its reference; ES has not.
- Why now
- This week’s inflation releases can strengthen rates relief or sustain restrictive policy pricing.
- Expression
- The individual September ES or NQ contract whose own recovery confirms. No pair or portfolio allocation.
- Trigger
- No standing entry. Evaluate a reclaim if inflation eases without deteriorating growth, or a failed recovery if restrictive pricing persists.
- Invalid
- Bullish case: the selected index loses its recovery. Bearish case: rates retrace and price holds. These are thesis conditions, not executable stops.
- Countercase
- A growth scare could lower yields while weakening equities. Lower rates alone would not qualify the bullish scenario.
- Horizon
- This week’s releases. Entry, exit and expiry require fresh session prices; neither scenario is an order.
Gold needs its own confirmation
- Status
- Watch; no structural direction or current entry established.
- View
- Supportive rates and dollar behavior matter only if gold also sustains its recovery.
- Why now
- Inflation week tests whether the macro backdrop and gold’s own price begin to agree.
- Expression
- Gold exposure remains under assessment. December futures supply the holiday reference; ETF observations elsewhere are separate instruments and windows.
- Trigger
- No vehicle-specific entry. Watch for a recovery with supportive rates/USD behavior.
- Invalid
- The recovery fails despite supportive rates and dollar conditions; no trade-specific stop is assigned.
- Countercase
- A growth scare can weaken equities even as yields fall. It does not automatically establish a gold entry.
- Horizon
- Inflation week; fresh quotes, vehicle selection and complete entry/exit rules remain necessary.
These are competing scenarios, not probability forecasts. A plausible thesis can still offer no acceptable entry.
Positioning supplies context
As of September 1, leveraged funds remained net short Nasdaq Mini futures by 14,092 contracts, after a weekly net improvement of 27,140. Most of that change came from fewer reported shorts. Yen net shorts increased by 25,146 contracts. These positions predate Friday's payrolls. They cannot establish today's buying, a crowded extreme or an inevitable squeeze. CFTC futures-only report
The level map
Friday’s price reference: September 4, 9:30 a.m.–4 p.m. ET, September futures contracts. These are trade-bar ranges and the last one-minute close, not official settlements or cash-index closes. Source: Databento, CME Globex minute bars.
| Contract | Reference |
|---|---|
| ESU6 | Cash-hours low: 7,711.75; Cash-hours high: 7,751.00; Last minute close: 7,723.75 |
| NQU6 | Cash-hours low: 29,468.00; Cash-hours high: 29,691.75; Last minute close: 29,568.75 |
Holiday range versus Friday cash hours: September ES has not regained its Sunday opening low at 7,715.25; the observed holiday low is 7,703.50 and high 7,728.50. September NQ finished above its opening high at 29,595.25, within a holiday range of 29,530.50–29,683.50. Friday's futures cash-hours boundaries above are a different session reference, not a contradiction or a substitute for the overnight map.
SPX cash: Friday's low 7,706.12 and high 7,750.19 remain the cash boundaries. The final 15-minute interval closed at 7,717.81; the separate official closing update was 7,718.60. No Monday cash confirmation exists.
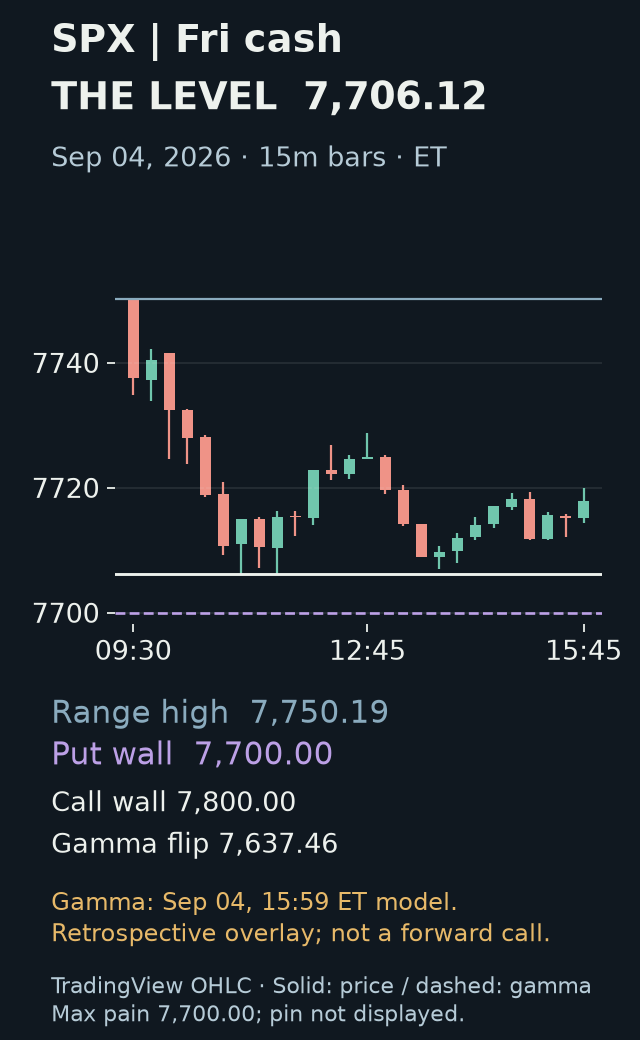
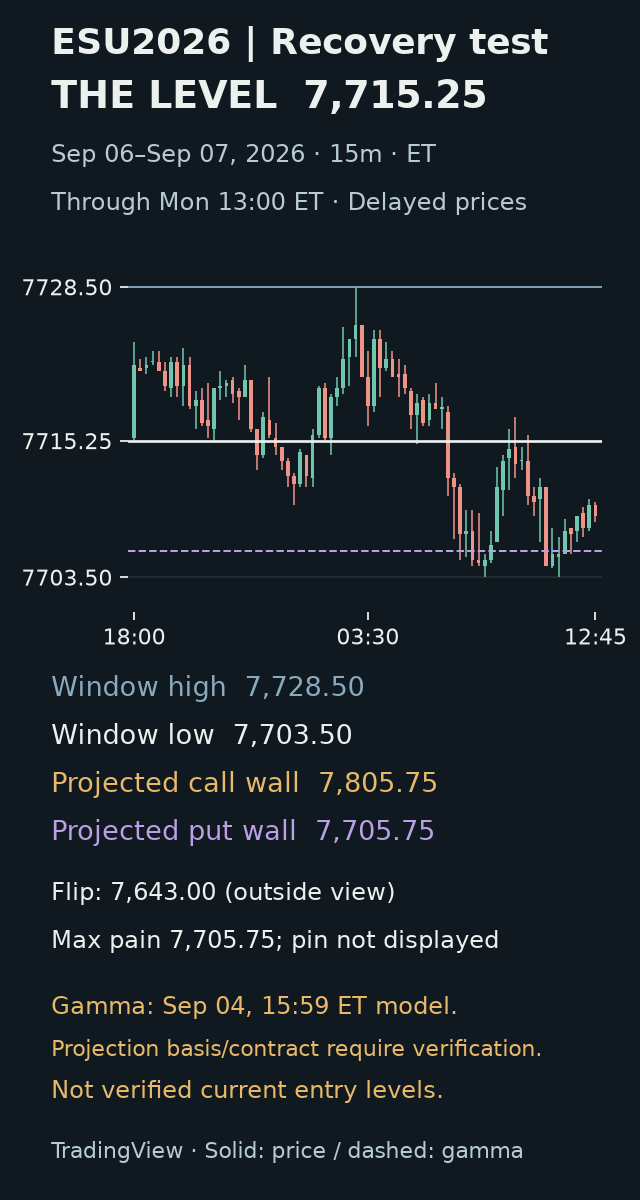
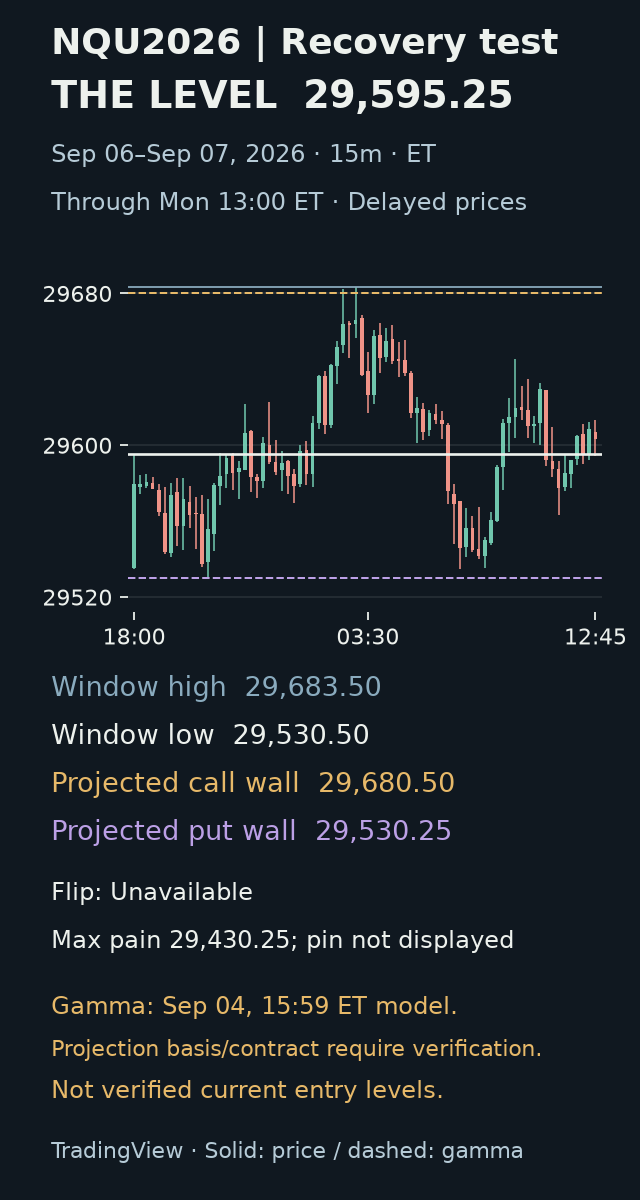
Derived gamma levels: modeled snapshots dated September 4, 3:59 p.m. ET, retrieved again September 7 at approximately 18:09 UTC. The models still carry Friday’s timestamp and closed-session status; these are prior-session estimates, not a live map. ES levels are projected from SPX options; NQ levels are projected from NDX options.
| Market / model axis | Reference |
|---|---|
| SPX | Call wall: 7,800; Put wall: 7,700; Gamma flip: ~7,637.46; Max pain: 7,700 |
| ES projection from SPX | Call wall: 7,805.75; Put wall: 7,705.75; Gamma flip: 7,643; Max pain: 7,705.75 |
| NQ projection from NDX | Call wall: 29,680.50; Put wall: 29,530.25; Gamma flip: Unavailable; Max pain: 29,430.25 |
The supplied net-gamma values are positive on all three model axes. That is model context, not evidence of actual dealer positioning or a bullish forecast. Exposure units and expiry scope are unspecified, so no dollar magnitude is quoted. Pin estimates are unavailable for all three; the provider reports no zero-day expiration. Max pain is a separate estimate, not a substitute pin or price target.
Projection limits: both futures mappings use a basis marked stale by the provider. The ES basis is dated 4:03 p.m. ET and the NQ basis 4:01 p.m.—both later than the model timestamp. Neither mapping identifies a futures contract or supplies synchronized cash/futures quotes. They cannot establish a tradable distance from the named futures closes above. Options-input and spot observation times are also unspecified.
The hunt for the next session: track whether ESU6 recovers Friday’s 7,751 high or loses its 7,711.75 low; for NQU6, the equivalent range edges are 29,691.75 and 29,468. A recovery that holds would strengthen the reclaim case; a failed recovery followed by a break of the low would strengthen the downside case. These are reference questions, not entry orders. Refresh the overnight range and gamma map before defining either setup. Do not place a futures Invalid at a stale projected wall, carry Friday’s gamma regime forward, or infer an NQ flip from max pain.
Energy — a crude draw with a demand counterweight
For the week ended August 28, commercial crude stocks fell 4.5 million barrels to 424.5 million, still 1% above the five-year average. Refinery utilization reached 98%. Gasoline inventories fell and were 6% below their five-year average; distillate stocks rose but remained 14% below theirs. Four-week total product supplied was down 4% year over year. EIA weekly summary
The question: does product tightness persist as refinery activity changes, or does weaker demand relieve it? The inventory draw alone does not decide that contest.
Diesel strength tests the refining thesis
- Status
- Analytical watch; no executable spread or refiner entry.
- View
- Diesel’s stronger comparison with crude supports investigating product tightness; gasoline has not supplied the same confirmation.
- Why now
- Thursday’s petroleum release tests whether stock rebuilding and product prices weaken that distinction.
- Expression
- Matched October diesel against WTI is the closest comparison. CRAK is a candidate only if the thesis broadens; its global holdings, currencies and business mix add exposures. BNO expresses Brent direction, a different thesis. VanEck · USCF
- Trigger
- None. Compare product strength and inventories before choosing a vehicle; refiner price, valuation and exposure checks remain incomplete.
- Invalid
- Inventories recover while product prices lose relative strength. Diesel losing its opening advantage would weaken that narrower comparison.
- Countercase
- Weaker demand could relieve tightness even after a crude draw; strength in both products would broaden the thesis.
- Horizon
- Next sessions and Thursday’s release. The calculations below exclude operating costs and are not executable margins.
Trigger / Invalid / Horizon: no executable spread entry is qualified. Diesel losing its opening advantage would undermine the relative-strength watch independently of gasoline. Strength in both products would broaden the opportunity. Reassess through Thursday's inventory release; equity selection additionally needs valuation and company-exposure evidence. The comparisons below are not net refinery profits or simultaneous executable quotes.
The overnight product split: at Monday's 1 p.m. ET bar endpoint, October crude was $92.47/barrel, gasoline $3.2268/gallon and ULSD $4.6831/gallon. Converting each product price at 42 gallons per barrel and subtracting crude gives:
| Indicative comparison | USD/barrel; change from Sunday's opening print |
|---|---|
| October gasoline minus crude | 43.06; −0.28 |
| October diesel minus crude | 104.22; +4.10 |
These matching-contract TradingView bar calculations use Sunday's 6 p.m. ET opening prints as the baseline, not Friday settlements. Diesel eased from $105.27 at 11 a.m. ET while gasoline improved from $42.84. Diesel retains the stronger opening-to-endpoint comparison, although its advantage narrowed; it does not establish persistent executable spread quotes. Calculations exclude operating costs, execution and physical-market differences. October prices do not settle a deferred gasoline or retail pump-price forecast. TradingView chart data
Energy positioning predates the latest price split. September 1 CFTC data show managed money net long 89,215 RBOB gasoline contracts and 20,344 ULSD diesel contracts. Net exposure rose by 9,563 and 3,703 contracts respectively from the prior week. Gasoline's change came mainly from additional longs; diesel combined additional longs with fewer shorts. CFTC futures-only report
What would weaken the tightness thesis: inventories recover while product prices lose strength relative to crude. A refiner equity also needs company-specific checks; it is not a pure refining-margin position.
Next catalyst: the holiday-delayed EIA petroleum release is Thursday, September 10, at noon ET, following that morning's PPI. Keep the two events distinct when interpreting energy's reaction. EIA schedule
Earnings — Broadcom's AI growth test
Broadcom reported fiscal Q3 revenue of $29.591 billion and adjusted operating income of $20.095 billion. Q4 guidance is approximately $34.8 billion of revenue and a 66% adjusted operating margin. Those figures imply roughly 17.6% sequential revenue growth and 14.3% adjusted operating-income growth, with margin falling from about 67.9% to 66%. These are calculations from management's figures, not consensus comparisons. Broadcom release filed with the SEC
Management guides AI semiconductor revenue from $16.7 billion to $21.7 billion. That $5 billion increase represents roughly 96% of the implied sequential increase in total revenue, using rounded guidance. Delivery of that AI outlook is central to the growth case. The figures alone do not explain the margin decline. Broadcom filing
Broadcom’s growth case needs a price response
- Status
- Company-specific watch; no entry or paired trade.
- View
- AI guidance supports a growth question, but Friday’s lag behind SOXX leaves the recovery case unconfirmed.
- Why now
- Assess whether subsequent price strength supports the outlook despite the guided margin trade-off.
- Expression
- AVGO for company-specific exposure; SOXX for comparison, not a proposed hedge. Its AVGO holding partly overlaps the exposure.
- Trigger
- No complete entry. Sustained matched-period relative strength would support evaluating a recovery; continued lag calls for investigating expectations and company risks.
- Invalid
- Relative recovery fails while the sector stabilizes. No numerical entry Invalid is established.
- Countercase
- Strong operating guidance may already be priced in; sector strength alone cannot establish attractive AVGO value.
- Horizon
- Next cash sessions. Fresh price, valuation, pre-release consensus and explicit expiry remain missing; directional cases are alternatives.
Friday's reaction: AVGO closed at $357.90, up 0.21%, while SOXX gained 3.52%. Broadcom lagged the semiconductor fund by roughly 3.31 percentage points that day. This is a one-session comparison of TradingView's reported daily changes, not the cumulative reaction since earnings. A stronger sector has yet to establish an AVGO recovery. AVGO daily data · SOXX daily data
Friday’s price remains a dated reference. The watch above is not an overnight position or an activated trade.
Benchmark choice: SOXX is a usable semiconductor comparison, but it is not an independent basket: AVGO represented 7.33% of its September 3 holdings. Shorting SOXX against AVGO would therefore offset part of the AVGO exposure while adding short exposure to other holdings. Compare matched-period price returns before calling relative strength; this is not a hedge ratio or a proposed pair position. iShares holdings, September 3
Tuesday's expectations checkpoint
The New York Fed's Survey of Consumer Expectations is due September 8 at 11 a.m. ET. Read the inflation horizons and the rates/dollar response together: lower expectations could support the rates-relief discussion, but the survey is not realized inflation or a policy decision. The weekly recovery thesis still needs price confirmation. New York Fed calendar
A weaker dollar can carry different messages
Dollar weakness could reflect strength elsewhere rather than relief in U.S. rates. Gold and equity recovery therefore need their own confirmation. Stand down on the rates-relief interpretation if the dollar falls but U.S. rates remain firm and the recovery fails. The inflation releases test that distinction; no entry is established.
Thursday earnings, Friday inflation
Oracle and Adobe both report after the close on September 10. Oracle's call starts at 5 p.m. ET; Adobe's also starts at 5 p.m. ET. Their first full regular session after results therefore begins after Friday's 8:30 a.m. CPI release. Oracle announcement · Adobe investor calendar
The opportunity: look for company-specific strength that survives a change in the broader tape. For Oracle, test whether demand converts into revenue and cash fast enough to support the buildout; more backlog alone does not settle the funding case. For Adobe, test whether adoption converts into paid recurring business, separating acquisition effects from underlying growth; free-user growth alone does not establish monetization. These are research questions for the releases, not claims about results or consensus.
Software demand meets the inflation test
- Status
- Catalyst watch; no pre-earnings position.
- View
- Company-specific strength is more persuasive if it survives the next macro reaction.
- Why now
- Thursday after-hours results precede Friday’s CPI and the first full regular session after earnings.
- Expression
- Oracle and Adobe are separate company watches. No earnings straddle, overnight position or interchangeable exposure is proposed.
- Trigger
- No executable entry. Watch favorable guidance followed by a recovery that holds after CPI.
- Invalid
- The earnings recovery fails while the broader market stabilizes; numerical price Invalids are unverified.
- Countercase
- An initial rally may reflect the broad macro move rather than the release. Separate the after-hours and post-CPI windows before attribution.
- Horizon
- Results and the following cash session. Prices, consensus, implied moves and entry levels remain unverified.
Index-change watch: separate the catalyst from the entry
Bloom Energy (BE), Illumina (ILMN) and Everpure (P) are scheduled to enter the S&P 500 before the September 21 open. The outgoing names move into the SmallCap 600, making the net flow picture more complicated than a simple buy-additions/sell-deletions trade. S&P announcement.
Index additions still need an entry case
- Status
- Event watch; no entry assigned.
- View
- Inclusion may affect demand, but the news alone does not establish opportunity after the price adjustment.
- Why now
- Follow the additions’ post-news ranges as regular trading resumes, ahead of the stated index change.
- Expression
- BE, ILMN and P are separate single-stock candidates. Outgoing names move to the SmallCap 600; no simple additions/deletions pair is proposed.
- Trigger
- None. Evaluate whether a post-news range holds and leaves room to a defensible exit.
- Invalid
- A gap falls back into its earlier range, weakening the demand thesis. No numerical stop is supplied.
- Countercase
- The expected flow may already be reflected in price; index membership does not settle valuation.
- Horizon
- Next regular sessions through the scheduled change. Avoid chasing without a clear Invalid and exit.
Across the book
Friday's cross-asset snapshot: September 4 daily ETF bars, viewed September 5 in TradingView. These are fund prices and rounded daily changes, not spot commodity prices, cash yields or credit spreads.
| Exposure / fund | Close | Daily change |
|---|---|---|
| Long Treasuries / TLT | $82.21 | +0.17% |
| Gold / GLD | $406.77 | −0.84% |
| Dollar / UUP | $28.08 | +0.25% |
| Oil futures fund / USO | $141.96 | −0.09% |
| High-yield bonds / HYG | $79.16 | −0.06% |
Gold weakened as the dollar fund rose, but the bond picture was mixed: TLT edged higher despite the two- and ten-year yield increases above. Maturity exposure and observation windows matter. HYG's small decline alone cannot establish wider credit spreads, and USO's near-flat day does not settle the product-tightness question. Watch whether those distinctions persist after inflation before turning a broad macro view into a position.
During cash hours, gold told a different story. From Friday's 9:30 a.m. opening bar to the final 15-minute bar close, the matched fund-price changes were:
| Fund | Cash-session price change |
|---|---|
| SPY / equities | −0.23% |
| TLT / long Treasuries | −0.09% |
| GLD / gold | +0.51% |
| UUP / dollar futures | +0.11% |
These calculations use dividend-adjusted TradingView chart bars, not the daily-close readings above or official closing-auction prices. UUP lacks the 2:15 p.m. bar; its opening and final observations are present, so the endpoint comparison is usable but its complete intraday path is not established. SPY · TLT · GLD · UUP
Gold: Friday's ten-year real Treasury yield rose 1 basis point to 2.43%; five-year real yield rose 2 basis points to 2.17%. That daily comparison offers no real-rate relief for the recovery thesis. Watch gold's own response alongside real yields and the dollar; it can resist a rates headwind, but that resilience needs to be observed. No current gold entry is established. Treasury real-yield feed
Exposure check: an NQ recovery and an AVGO long would both depend partly on technology strength. An index recovery and gold strength could also share one premise: easier rates after inflation. Those are overlapping exposures, even though the instruments differ. Refining has a separate operating story, but a refiner stock would still carry company and broad equity risk. None of these watches specifies a portfolio allocation.
After the Bell: revisit whether the stated conditions appeared, what changed the thesis, and which watches remain relevant. The scenarios in this outlook are research watches, not reported trades or returns.
Kill the Level · Spot. Plan. Kill.
For educational and informational purposes only. Not personalized investment advice or a recommendation to buy or sell a financial instrument. Trading involves risk, including loss of principal. Past or hypothetical results do not indicate future results.
Edition sources, version & corrections →
Some linked sources change over time. Check the edition’s cited period.